‘Right’ analysis, wrong conclusions, again
Better Places is the latest output from the influential right leaning think-tank Policy Exchange. The big idea, as reflected in the report’s sub-title, is a matrix for measuring and delivering placemaking quality. The result is captured in a ‘PAX score’ (appropriating the Latin word for peace) for new developments that would feed into development management decision-making.
In two previous blogs – ‘Right’ analysis, wrong conclusions 1 and 2 – I explored other recent reports from the ‘Building Beautiful Programme’ from which this report emanates. Like those, Better Places receives strong endorsement from the Secretary of State, Michael Gove who describes it as “no less than a detailed instruction manual for how we can create the good places of the future”. High praise indeed! So what is thisPlacemaking Matrix?
The Placemaking Matrix is what is known in urban design governance as an ‘indicator tool’. In my recent book indicators are defined as tools that “seek to measure and represent aspects of performance – in this case design quality – in a manner that can be easily shared and understood”. Better Places defines this new matrix as “what we believe to be a ground-breaking attempt to develop a universal tool capable of measuring how successful developments will be, (or are) at placemaking for the very first time”.
Unfortunately, the tool is not nearly as original as the report and its endorsement make out. Indicators of this type are part of a tradition that goes back a very long way in urban design. Rarely are they as ground-breaking or useful as their authors believe them to be.
One of many indicator tools
An early indicator tool was The Scanner, produced in 1966 by Gordon Cullen as a part of a series of pamphlets commissioned by Alcan Industries. This 24 page brochure included a two page matrix to encourage designers to systematically ask: “Have I considered …” all the critical human and physical design elements of urban settlements. Since then, indicator tools have regularly appeared with different forms, emphases and degrees of detail. Almost always they contain:
- some form of desired checklist of issues to be considered when designing, accompanied by
- some means of scoring the outcomes to ‘indicate’ the level of quality being achieved.
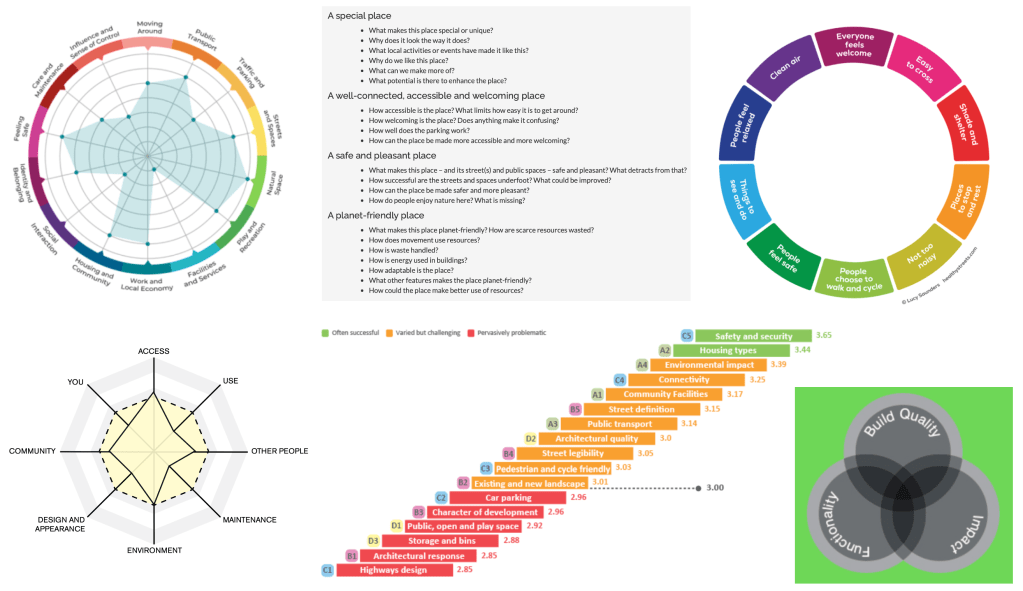
One of the best known tools of this type is mentioned in Better Places, the Place Diagram of New York’s Project for Public Spaces (PPS), “a tool to help people in judging any place, good or bad”. PPS have used this over decades to structure their analysis of places and to promote their brand. Nationally, the report draws attention to various indicator tools that are used either at the individual building scale – BREEAM, Energy Performance Certificates, The Well Building Standard – for transport planning – PTALs – or beyond the built environment altogether, notably Energy Efficiency Labels and Ofsted Ratings.
It notes “we live in an age where either the state or the private sector has established an increasing array of scoring systems to determine the quality of all manner of functions and activities pertinent to public life. This has not yet happened with placemaking”. This seems a curious statement given the existence of numerous indicator tools that significantly overlap with the new Placemaking Matrix, including some that overlap to the point of replication (in intention if not content).
| 1. Building for a Healthy Life (BHL) aims “to help those involved in new developments to think about the qualities of successful places and how these can be best applied to the individual characteristics of a site and its wider context”. BHL has been around in various incarnations since 2003. It is explicitly mentioned in the National Planning Policy Framework and is formally adopted by Homes England as the quality benchmark for the allocation of public funding for social housing. |
| 2. Placecheck has been in existence since 2000 and in its current guise consists of 21 questions and 131 extra prompts to evaluate the quality of places or projects. |
| 3. Gardencheck is a specialist form of Placecheck focussing on the quality of gardens. |
| 4. Place Standard offers a simple framework based around 14 sets of issues to structure conversations about the physical and social qualities of place. Developed for the Scottish Government, this tool is now being adopted elsewhere in Europe. |
| 5. Healthy Streets focusses specifically on the quality of streets to make them more healthy places for users. The tool has been central to the development of street-based policy and standards in London, but its framework of ten criteria for healthy streets is now used internationally. |
| 6. The Design Quality Indicator (DQI) was launched in 2002 by the Construction Industry Council as a process based on the Vitruvian principles of Firmitas (durable), Utilitas (Useful) and Venustas (Beautiful). The tool enables design quality to be measured throughout the development process. |
| 7. Design Quality Indicator for Health 2 was commissioned in 2010 by the Department for Health and is a specialist DQI for healthcare settings. |
| 8. Spaceshaper was developed in the 2000s by CABE, originally from the DQI system. It is an indicator tool designed to evaluate and represent the qualities of public spaces in a manner that can be used and understood by anyone from professionals to communities. |
| 9. BREEAM Communities evolved out of the internationally recognised BREEAM assessment tool, but rather than focussing on buildings, it assesses environmental sustainability at the neighbourhood scale. |
| 10. LEED for Neighbourhood Development provides an assessment and certification scheme similar to BREEAM Communities. It emanates from the USA and is designed to encourage the development of more sustainable and connected neighbourhoods. |
| 11. A Housing Design Audit (and previous audits) are not indicator tools but have at their core indicators to allow ready comparison between developments at the place-based scale. The recent Place Alliance audit used seventeen criteria, each interpreted through two or three sub-criteria. |
| 12. Pedestrian Environment Review System (PERs) offers a proprietary means of recording the quality of the pedestrian environment in a systemised manner as part of a walking audit. |
While each of these has their own particular focus, means of representation, levels of sophistication and costs (from free to expensive), like the new Placemaking Matrix, they provide a framework for evaluating different aspects of place quality that extends across the tangible and intangible qualities of place.
So what is special about the Placemaking Matrix?
Turning to the content of the new matrix, questions are divided into three groups, relating to the ‘physical’, ‘socio-economic’ and ‘psychological’ elements of new development. Each group carries one third of an overall PAX score and are further subdivided into 12 sub-categories with different weightings “according to the impact of the said category and the extent of autonomous control the developer would be able to exert over it” – I will return to this. Subcategories are further divided into questions – 274 in total – each needing to be scored on a scale from 0-4, with the final weighted score out of 100 equating to ‘outstanding’ (>70%), ‘good’ (60-69%), ‘average’ (50-59%+) and ‘poor’ (<49%).
It is here that the report claims “a pioneering departure from conventional placemaking practice”. It argues that “while it is relatively easy to define physical attributes and, to a slightly lesser extent, socio-economic ones, no previous study or standard has attempted to quantify the psychological content of places and yet these are arguably the most important when assessing their human impact. The PAX system does just this”.
Again, this seems wide of the mark, as each of the pre-existing place-based indicator systems include a range of psychological factors. The Scanner, for example, was long ago based on the idea of creating urban fabric that could elicit an emotional response. Factors were divided between physical factors, described as “the mould into which mankind is poured”, and human factors that elicit profound emotional reactions of “happiness or sadness, fulfilment or despair”.
The reality is that such issues are messy in the sense that they cannot easily be articulated, evaluated, or pigeon-holed as our sense of psychological well-being stems from multiple overlapping aspects of the socio-physical environment, many of which only become truly apparent after a project is complete and in use. The new matrix, unintentionally, reflects this messiness. Issues relating to ‘crime & safety and ‘users and inclusivity’, for example, are included in the main socio-economic category, but they might equally, and perhaps more appropriately, be included in the psychological category. Likewise, many factors included under ‘sense of place’ in the psychological category are largely aesthetic and might easily have been placed in the physical category. The point is that academics and practitioners have been grappling with this as long as we have recognised that this was a field that needed to be grappled with. Universal truths or original thinking in this space is rare indeed.
Less (questions) is more (informative)
So if this aspect of the Matrix is not its unique selling point then what is? The tool certainly wins the prize for the most questions included in such an indicator tool, by some distance.
When it was first published in 2000, Placecheck consisted of a list of around 100 questions, offering a comprehensive checklist for communities or practitioners to evaluate their surroundings. The result was a rather stodgy set of issues for users to wade through in order to get to some conclusions about the quality of their projects or places (I know, I used it!). Perhaps recognising this, in recent iterations headline questions have reduced to 21, with a set of more detailed prompts to help if needs be. Building for a Healthy Life, likewise, has been on a journey from more to less detail across various incarnations. These began with 20 (Building for Life) questions in 2003, reduced to 12 (Building for Life 12) questions in 2012, and these were refined further in 2020 for Building for a Healthy Life. Other indicator tools typically have a clear and simple normative framework at the core of their analysis.
The experience of undertaking A Housing Design Audit in 2020, likewise, suggested very strongly that consistency of interpretation required less rather than more criteria. In that case, 17 design considerations were each carefully defined and tested prior to elucidation through a maximum of two or three sub-criteria. By contrast, the Placemaking Matrix involves 12 sub-categories of the three main categorisations, some with up to 76 sub-questions in which literally everything but the kitchen sink forms a legitimate focus for enquiry.
The result is that many questions duplicate issues; others will be almost impossible to evaluate in a consistent manner (e.g. Do any privately owned public spaces maintain public character?); or reflect particular stylistic preferences (e.g. Do street facades generally maintain a rhythm of vertical articulation?); while others are almost impossible to understand (e.g. Does the public realm management plan have the capacity to market or promote the development in areas outside the development?). Yet others are about design process rather than design outcomes (e.g. Was public polling undertaken at any stage of the design, planning or development process?); some don’t concern design quality at all (e.g. Is free public Wi-Fi provided across the development?); or, depending on the scale of the project, may very well not be relevant (e.g. Has communal gym equipment been provided in public spaces?). A few are simply impossible to answer, including the final question, Does the development promote a visual brand, motif or logo?.
Avoiding pseudo-science, cliff-edges and bias
Assuming that the 274 questions posed in the Placemaking Matrix are illustrative only, and that further refinement, explanation and considerable consolidation was undertaken, it remains important not to give the impression of being too pseudo-scientific with such tools. The seemingly definitive nature of the assessments that indicator tools provide, particularly those that end in a single number or descriptor rather than a profile of qualities, can be misleading. In this case, a very exact percentage is given to two decimal places.
Interestingly, Better Places references the Ofsted rating system that is used to evaluate the quality of teaching in English Schools. In that system, an exhaustive Inspection process, often over several days, is summed up in a single headline rating: ‘outstanding’, ‘good’, ‘requires improvement’ or ‘inadequate’. This is despite the fact that the report backing up these judgements has all sorts of nuances that are quickly lost in the crude headline. The challenges of such a system with its cliff-edge assessment categories have recently been in the news. Partly to address such problems, the UK-wide Research Excellence Framework (REF) that every five years or so is used to evaluate the research strengths of UK universities moved in 2014 from a system summed up as a star rating (unclassified to 4*) to a published profile in three areas: ‘outputs’, ‘impact’ and ‘environment’. To some degree the move took the heat out of the results.
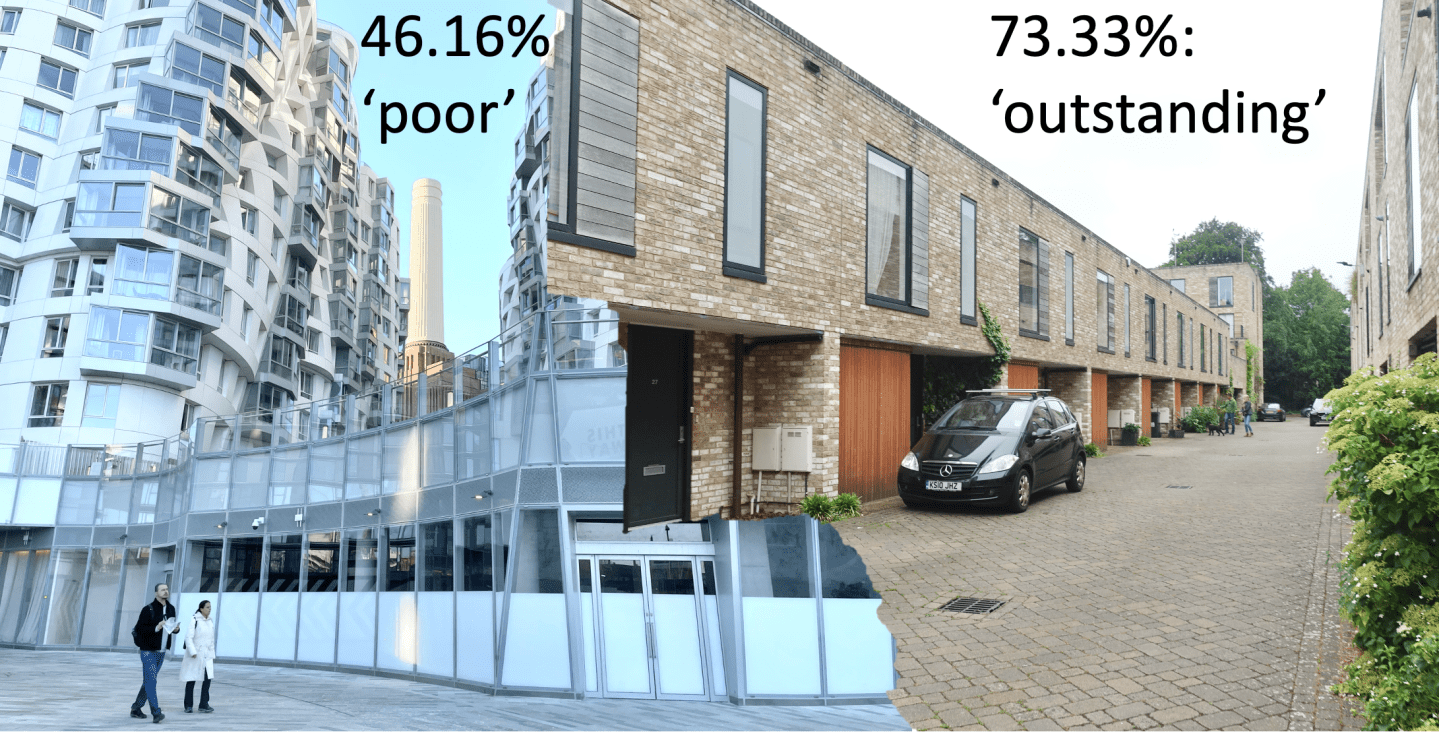
To explain its approach, three trial cases are included in Better Places: a huge and unfinished mixed use mega-development in London (scored 46.16% – poor); a small bespoke and well matured housing scheme in Cambridge (scored 73.33% – outstanding) and an ongoing regeneration of an historic ex-mining village in Scotland (scored 66.33% – good). The problem is that these schemes are profoundly different in scale, architectural style, state of completion, socio-economic context, mix of uses, presence of historic assets, and so on, making comparison almost meaningless. Despite this, the results and the discussion suggest that they have been subject to a credible, authoritative and universal assessment, resulting in a definitive comparative statement of quality. They serve to demonstrate the danger of a simple percentage and textual summation as well as the challenges of bias.

On this final point, the comments accompanying the trial cases clearly show a dislike for high rise buildings and avant-garde architecture that are respectively described as “unwarranted incursion” and “a shocking array of the architectural aberrations”. The danger of any tool that allows architectural taste to hold sway is that the resulting evaluation will be a foregone conclusion before it has even begun.
More (bureaucracy) is less (creative engagement)
Better Places recognises that impartiality and objectivity may be a problem, and to overcome distortions stemming from personal preference the report suggests that schemes should be assessed on two separate occasions, the first formative in nature, during the design process, and the second summative, submitted with a planning application. Planners assigned to projects for development management purposes, it argues, should not be trusted to make such assessments, and instead a separate officer, urban designer or architect should be appointed to the task, alongside two other PAX assessors. These, it suggests, could be from the development team, local authority or community. In total some 1,644 questions would need answered across the three assessors.
Given this, it is odd that the report argues that the Placemaking Matrix “has been designed to ensure that it does not unduly add to the frequently onerous list of bureaucratic compliances that the planning process already imposes on proposed residential developments”. Why other aspects of planning are bureaucratic, and this is not, is not entirely made clear. What is clear is that the resource implications of the suggested process is not really considered, not least the work that would need to be foregone in order to tick all the PAX boxes.
More time spent by local authority design staff (who are in short supply) answering a long list of standardised questions is surely less time available for the sorts of proactive and creative inputs that the planning system lacks, namely time to prepare positive site-specific design guidance and to negotiate and improve projects on a case-by-case basis. Personally, I can’t imagine many design officers relishing the prospect of time spent completing PAX assessments, and this sort of work will quickly be devolved to administrators (as it is in many as-of-right zoning systems) or result in a rapid exodus of urban design officers in search of more stimulating ways to fill their days.
The dangers of reductionism
Ultimately in a discretionary planning system which, for better or worse, we still have, the quality of decision-making comes down to:
- the professionalism and skills of those who operate it (the planners and design officers)
- the time they have at their disposal to do a thorough job (on the design front that means time to analyse, guide, evaluate, challenge and actually design), and
- the backing they receive to do their jobs from local and national politicians.
Perhaps because we have a discretionary system, we seem to spend a long time inventing tools that will somehow make those processes more scientific, streamlined and objective when, in reality, they never will be.
While other countries use indicator tools (including LEED Neighbourhoods, BREEAM Communities and the Place Standard), nowhere invents them with quite the frequency and relish that we do in the UK. Indeed, my recent research examining the use of informal tools of urban design governance across Europe found very few examples of such tools outside the UK, despite a continent-wide survey. It also revealed a widespread perception amongst European professionals that such tools are essentially reductionist, reducing complex judgements that need to be weighed and balanced by skilled staff down to simplistic questions. This was perceived to be a particular problem in relation to the more intangible design considerations where qualitative judgement is required, as opposed to those where a quantitative assessment is possible, such as energy efficiency. Many of the issues identified as ‘psychological’ in Better Places fall into this category.
It is notable then that the most widely used place-based indicator tool in the UK, Building for a Healthy Life, has recently moved away from a question-based format to one centred on written and visual prompts. This, it was argued, was “a tactical shift in emphasis. Questions demand a quick response whereas good design requires more time, analysis and thought”. By contrast, the Placemaking matrix is structured entirely though questions.
So what are place-quality indicator tools good for?
In a complex multi-dimensional field such as urban design that cuts across physical, social, aesthetic, economic and other realms, it is inevitable that design indicators will be reductionist. Despite this, they have value in a number of important situations:
- The first is as thinking and conversation tools, helping to structure a formative discussion about what is desirable in connection with a proposed scheme, or alternatively what is successful or unsuccessful about places that are already built. This is the essential purpose of many of the simpler indicator tools such as the Place Standard and the Design Quality Indicator.
- The second is as a basis to reward projects and project teams. This might be part of an awards programme or a means to give projects the status of a particular label or rating scheme. LEED and BREEAM are of this type but have a bias towards the technical aspects of design that are more easily evaluated through such tools.
- The third is as a backstop where a tick box tool is used in the absence of a skilled evaluation process. This often occurs in as-of-right zoning systems where evaluation is largely a bureaucratic process rather than one based on professional judgement. The Healthy Streets tool offers a case-in-point. Its use in the highly regulatory field of highways design has been able to bring a design sensibility to an otherwise purely quantitative evaluation. Planning, in the UK, has never been such a field.
- A fourth (related) case is where an assessment needs to be made in one field of competence (e.g. design quality) to establish a benchmark for the release of funding in another (e.g. social housing). In England, the use of Building for a Healthy Life scores prior to the release of funding for social housing is an example.
- A final case is when indicator tools are used as part of a larger summative audit process in which a stocktake of quality is being undertaken across many schemes. In such cases the challenges of using indicator tools are offset by the numbers of assessments made, with inconsistences in individual interpretation and judgement evened out across such audits.
Separately, there may also be a role for a checklist as part of a design code for use during the evaluative process. Critically, however, these should not be generic lists like the Placemaking Matrix, but should emerge out of and summarise the code itself. In turn the code should be generated out of a profound place-based understanding of the site or place to which the code relates. Ultimately, interpreting a design code (just like a planning application) involves judgement and not a simple tallying of scores against an inflexible framework.
No substitute for design skills!
The real danger lies when indicator tools are seen as a substitute for design skills. In a field like urban design where the subjective is mixed with the objective and value judgements are rife, indicator tools can all too easily become value laden, generated through personal or collective preference, rather than on the basis of evidence.
In the Placemaking Matrix, the weighting of ‘public transport’ and ‘crime & safety’ as worth just 40% of ‘building appearance’ is an example of this. According to the report, this is because they “do not fall directly under the developers remit”. But downplaying such issues only acts to excuse the development of locations that are clearly unsustainable and should not be developed at all, no matter how beautiful the resulting development might be.
Ultimately, no amount of box ticking can ever act as a substitute for a creative publicly engaged design process. If we are too mean or too short-sighted as a society to train and employ enough urban designers and think that a box ticking exercise will do instead, then we deserve everything we get. This is about where we invest our time, limited resources and creative energies. For me, that should always be in the process of design, with indicator tools kept in the urban design governance toolbox as an occasional support to, but not a substitute for, design-led place-shaping.
Matthew Carmona
Professor of Planning & Urban Design
The Bartlett School of Planning, UCL
